With ever-increasing user expectations in today’s fast-paced digital landscape, ensuring seamless performance of applications is paramount. This is where Prometheus steps in: A powerful ally in the realm of system monitoring and alerting.
What is Prometheus?
Prometheus is an open-source monitoring and alerting toolkit designed to record real-time metrics in a time-series database. It excels in collecting, storing, and analyzing metrics, providing a comprehensive view of your system’s health and performance.
The performance and reliability of your digital services directly impact customer satisfaction and revenue. Effective monitoring of application enables you to:
- Ensure Reliability: By continuously observing system metrics, you can proactively address issues before they escalate, maintaining uninterrupted service delivery.
- Optimize Performance: Monitoring provides insights into resource utilization, helping you make informed decisions to enhance efficiency and reduce operational costs.
- Drive Strategic Decisions: Data-driven insights into user behavior and system performance inform strategic planning, product development, and marketing initiatives.
Prometheus offers a multi-dimensional data model and powerful query language, enabling detailed and dynamic analysis of your systems. Its integration capabilities with various systems and services make it a versatile tool for comprehensive monitoring.
Incorporating Prometheus into your operations not only empowers your technical teams to maintain system health but also provides business leaders with the required visibility to steer the company toward sustained success.
By embracing Prometheus, you’re not just adopting a monitoring tool; you’re investing in a strategic asset that aligns technological performance with business objectives, ensuring your organization remains resilient and competitive in the digital age.
In this blog, we’ll explore how to harness Prometheus (an open-source monitoring system) and Grafana (a leading analytics and interactive visualization platform), to gain actionable insights into your applications. By integrating Prometheus’s robust data collection capabilities with Grafana’s dynamic dashboards, you can effectively monitor performance, identify issues, and make informed decisions to enhance your systems’ reliability and efficiency. Here’s what we’ll cover:
1. Basic Overview of Prometheus metric types
2. Setting Up Your Monitoring Environment
A step-by-step guide to installing and configuring Prometheus and Grafana, ensuring a solid foundation for monitoring.
3. Leveraging Default Metrics
Discover how to utilize the default metrics provided by Prometheus to monitor your applications effectively.
4. Creating Custom Metrics
Learn how to implement custom metrics in both Java and Go applications to capture data specific to your business needs.
5. Understanding Prometheus Metric Types
Dive into the different metric types: Counters, Gauges, Histograms, and Summaries and understand their applications in real-world scenarios.
Understanding Prometheus Metrics Types
Understanding Prometheus’s four core metric types: Counters, Gauges, Histograms, and Summaries is essential for effective system monitoring. Let’s explore each metric type with real-world examples to illustrate their practical applications.
1. Counter
Definition
A Counter is a cumulative metric that represents a single monotonically increasing value that can only increment or reset to zero upon restart.
Examples
- Total Number of Processed Orders: In an e-commerce platform, a counter can be used to track the total number of orders processed since the application was launched. The counter increments with each new order, offering valuable insights into the platform’s sales volume and overall performance trends over time.
- Total Number of Errors Encountered: Monitoring the total number of errors helps in identifying trends and potential issues in the application. Each error occurrence increments the counter, allowing teams to monitor system reliability and identify potential issues proactively.Key Characteristics
- Counters only increase; they do not decrease.
- They provide a straightforward way to track the occurrence of specific events.
2. Gauge
Definition
A Gauge represents a numerical value that can fluctuate up or down, reflecting the current state of a metric.
Examples
- Current Number of Active Users: A gauge can monitor the number of users actively connected to a service at any given moment, providing real-time insights into user engagement.
- System Memory Usage: Tracking memory usage helps in understanding resource utilization and identifying potential bottlenecks.
Key Characteristics
- Gauges can increase and decrease, offering flexibility in monitoring dynamic metrics.
- They are ideal for metrics that represent a snapshot of the current state.
3. Summary
Definition
A Summary samples observations and provides a total count, sum of observations, and configurable quantiles (e.g., a quantile shows the value below which a certain percentage of data falls, such as the 95th percentile representing the value faster than 95% of requests), offering insights into the distribution of values over a sliding time window.
Examples
- API Response Time Monitoring: A summary can track the response times of API endpoints, calculating quantiles such as the 95th percentile to understand typical and outlier response times.
Key Characteristics
- Summaries provide direct quantile estimation that is useful for monitoring service-level objectives.
- They are beneficial when precise quantile values are required.
- Histogram
4. Histogram
Definition
A Histogram samples observations and counts them in configurable buckets, allowing for the analysis of the distribution of values, such as request durations or response sizes.
Examples
- Request Duration Analysis: A histogram can track the duration of HTTP requests, categorizing them into buckets (e.g., 0–100ms, 100–200ms). This helps in understanding the distribution of request latencies and identifying performance issues.
Key Characteristics
- Histograms provide a detailed view of how values are distributed across different ranges.
- They are useful in identifying patterns and anomalies in metrics.
Setting up your monitoring environment
Setting up the Prometheus server
To monitor your application using Prometheus, you’ll need to set up a Prometheus server. We will use Docker to accomplish this.
Follow the steps below:
Step 1: Create a Prometheus configuration file
First, create a configuration file named prometheus.yaml with the following content: 
Step 2: Create a Docker file
Next, create a Docker file to set up an image with our Prometheus configuration:
# Use the official Prometheus image as the base
FROM prom/prometheus:latest
# Copy the custom configuration file into the appropriate location in the container
COPY prometheus.yaml /etc/prometheus/prometheus.yml
Step 3: Create a Docker-compose
Although we could directly create a container from this image, using a docker-compose.yml file simplifies the process and is recommended for easier management of containers and their data
# Create a prometheus container, the data is stored in the prometheus folder,
# which is mapped to the container’s /etc/prometheus folder.
# In system it is mapped to ./prometheus/data folder.
services:
prometheus:
build:
context: ./prometheus
container_name: prometheus
ports:
– “9090:9090”
volumes:
– ./prometheus/data:/prometheus
Step 4: Build and run the Prometheus container
With the configuration files in place, run the following command to build and start the Prometheus server:
> docker-compose up –build Prometheus
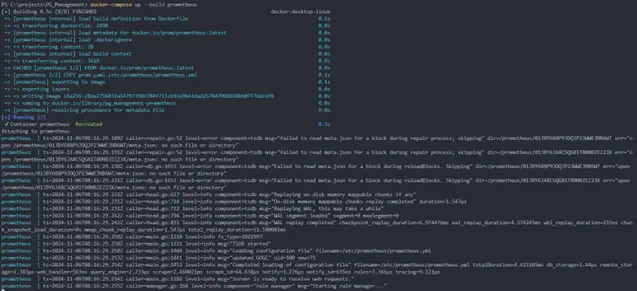
The Prometheus server should be up and running on port 9090.
Step 5: Verify Prometheus is up and running
To ensure that Prometheus is set up correctly, navigate to http://localhost:9090 in your web browser. You should see the Prometheus dashboard. You can explore available metrics by clicking on the “Status” tab and then “Targets”. Here, you should see the pg-manage job listed with its target and status.
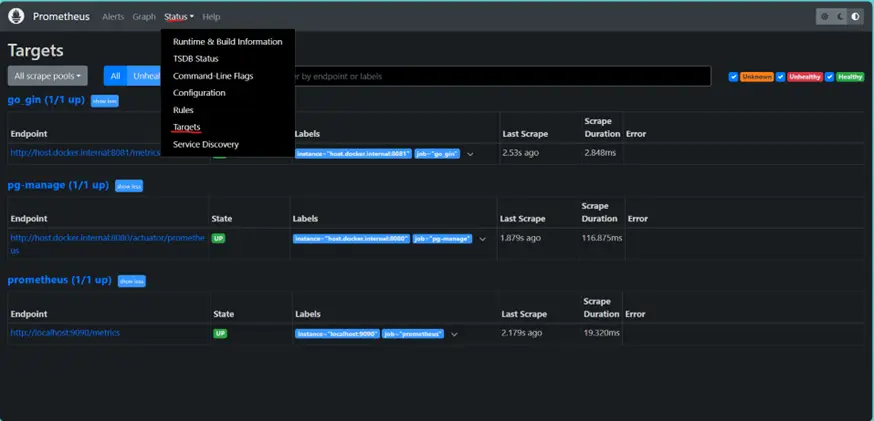
With the above-mentioned steps, you should be able to query and visualize basic application metrics such as disk_total_byte, process_cpu_usage and many more.Yyou can explore the metrics available by using the Prometheus UI.
Setting up Grafana with Prometheus
Prometheus, while powerful, lacks advanced dashboarding features. This is where Grafana comes in – an open-source dashboard builder that integrates seamlessly with Prometheus. Let’s explore how to set up Grafana on your local machine and connect it with a Prometheus server.
Downloading and running Grafana
- Using Docker
You can integrate Grafana with your already existing docker-compose.yml file, just add this Grafana container section:
grafana:
image: grafana/grafana
container_name: grafana
ports:
– “3000:3000”
volumes:
– grafana-storage:/var/lib/grafana
volumes:
grafana-storage:
- Using pre-built binaries
Alternatively, you can download and run the pre-compiled binaries from the official Grafana website download page.
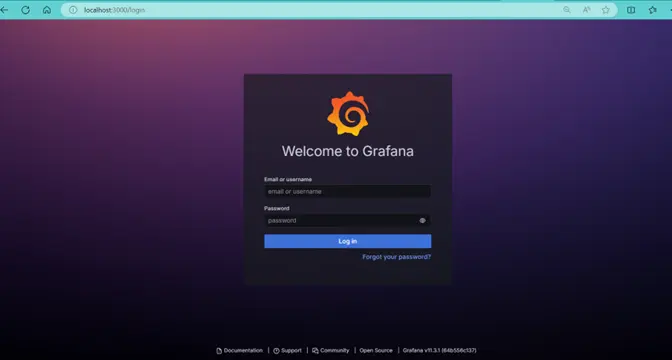
Once the setup is complete, Grafana should be functioning on http://localhost:3000. The default login credentials are admin for both username and password.
Connecting Grafana to Prometheus
After logging in, the next step is to configure Grafana to pull data from Prometheus.
1. Add a Data Source
- Go to Connections > Data Sources (or you can just directly click on the link in home page to configure data sources) > Select “Prometheus” in the data source list.
2. Configure Prometheus Data Source
- Since we are running Grafana inside a Docker container and Prometheus server locally, set the Prometheus server URL to: http://host.docker.internal:9090. If you do not have Prometheus running locally, you can use the Prometheus demo URL: https://demo.promlabs.com.
- Leave other parameters as default unless specific security settings are required.
- Click Save and Test to confirm the connection.
With Grafana connected to Prometheus, you can now create dashboards to visualize your metrics. Navigate to the Dashboards section to start building and customizing your visualizations.
Setting up your Java application
Step 1: Add dependencies
In your Spring Boot project’s pom.xml file, you need to include the following dependencies to enable actuator and Prometheus support:
org.springframework.boot
spring-boot-starter-actuator
io.micrometer
micrometer-registry-prometheus
Step 2: Configure application.properties
Next, you need to configure your application.properties file to expose the necessary endpoints and ensure detailed health information is available. Add the following properties:
management.endpoints.web.exposure.include=*
management.endpoint.health.show-details=always
Note: If your application has Spring Security enabled, make sure to whitelist the actuator endpoints to allow Prometheus to scrape the metrics.
For development purposes, it is convenient to expose all actuator endpoints by setting
management.endpoints.web.exposure.include=*
However, for production environments, you should carefully select which endpoints to expose to avoid revealing sensitive application information.
Always review and secure your endpoints before deploying your application to a production environment.
Step 3: Running the application
With the dependencies added and properties configured, you can now run your Spring Boot application. Once it is running, you can access the Prometheus metrics by sending a GET request to the /actuator/prometheus endpoint.
You should see a list of default metrics provided by Spring Boot and Micrometer.
Setting up your Go application
Here’s a step-by-step guide to help you set up Prometheus and start collecting metrics effortlessly.
Step 1: Add dependencies
To begin, you’ll need to include Prometheus libraries in your Go project. These libraries enable your application to collect and expose metrics that Prometheus can scrape.
Run the following commands to install the necessary packages:
go get github.com/prometheus/client_golang/prometheus
go get github.com/prometheus/client_golang/prometheus/promauto
go get github.com/prometheus/client_golang/prometheus/promhttp
- Prometheus Client: The prometheus package provides core functionalities for metric collection.
- Promauto: The promauto package simplifies the process of registering metrics automatically.
- PromHTTP: The promhttp package offers HTTP handlers the ability to expose metrics via an endpoint.
Step 2: Adding a /metrics endpoint
Next, you’ll expose the collected metrics through a new endpoint in your application. This endpoint allows Prometheus to access and collect the metrics data at any point in time. Prometheus will periodically call this endpoint to collect application’s current state metrics and save against time series.
In your main.go file, add the following code (using the Gin web framework):
import (
“github.com/gin-gonic/gin”
“github.com/prometheus/client_golang/prometheus/promhttp”
)
func main() {
r := gin.Default()
r.GET(“/metrics”, gin.WrapH(promhttp.Handler()))
r.Run(“127.0.0.1:8081”)
}
Here, we import Gin for handling HTTP requests and Prometheus’s promhttp for exposing the metrics.
and in the line: r.GET(“/metrics”, gin.WrapH(promhttp.Handler())), we set up the endpoint that serves the metrics.
Now, navigate to http://127.0.0.1:8081/metrics in your web browser. You should see a list of metrics being exposed, providing valuable data right out of the box.
Using Default metrics in Prometheus.
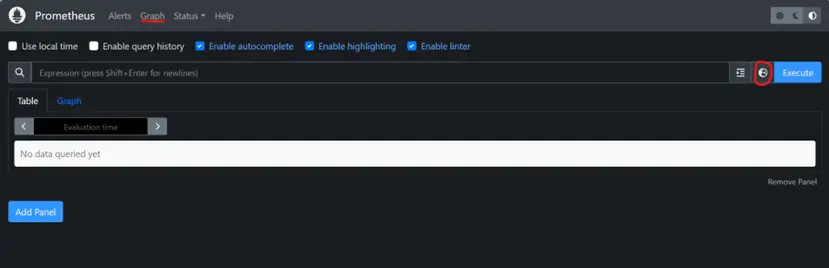
After enabling metrics in your Go application, you can access them via the /metrics endpoint or explore them on the Prometheus interface at localhost:9090. Now, let’s create a dashboard in Grafana to visualize these key metrics, which are essential for monitoring and optimizing your application’s performance.
Steps to Create a Dashboard in Grafana:
- Navigate to Dashboards: Open Grafana and go to Dashboards > New Dashboard.
- Add Visualizations: Click on Add Visualization and select your data source (Prometheus).
- Build your Query: Use the query builder to select the metrics you want to visualize. For advanced customization, switch to code mode to modify your query directly.
Key metrics to monitor (Go):
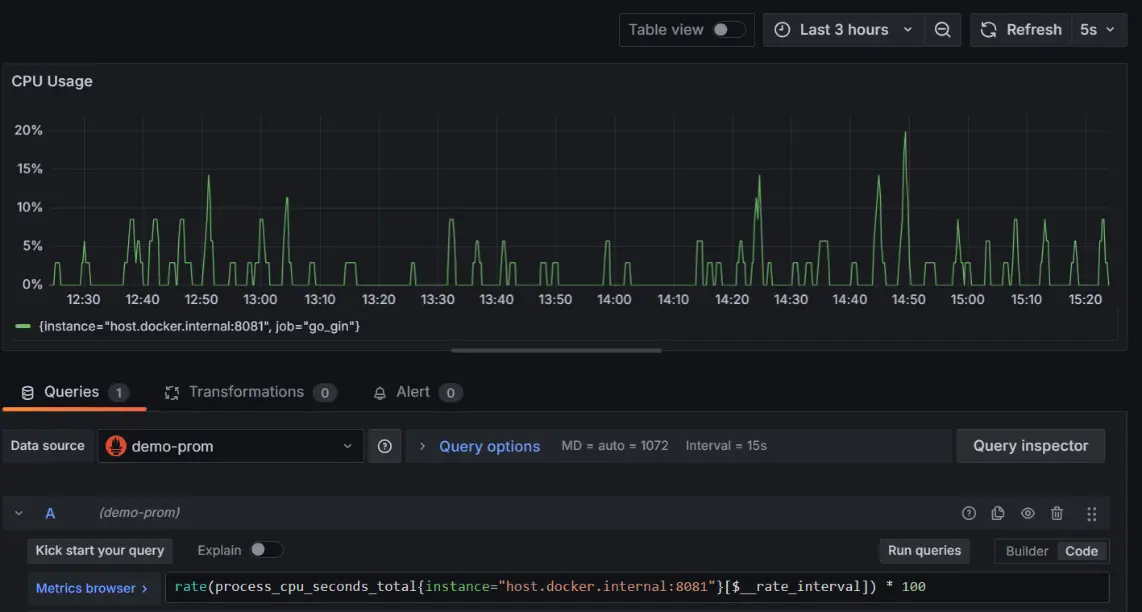
1. CPU usage (process_cpu_seconds_total):
- The total CPU time consumed by your application.
- Query:
rate(process_cpu_seconds_total{instance=”host.docker.internal:8081″}[$__rate_interval]) * 100
- This query calculates the average CPU usage percentage of a specific application over a recent time interval, helping monitor resource efficiency. It focuses on how much processing power is consumed, ensuring operational insights for better decision-making.
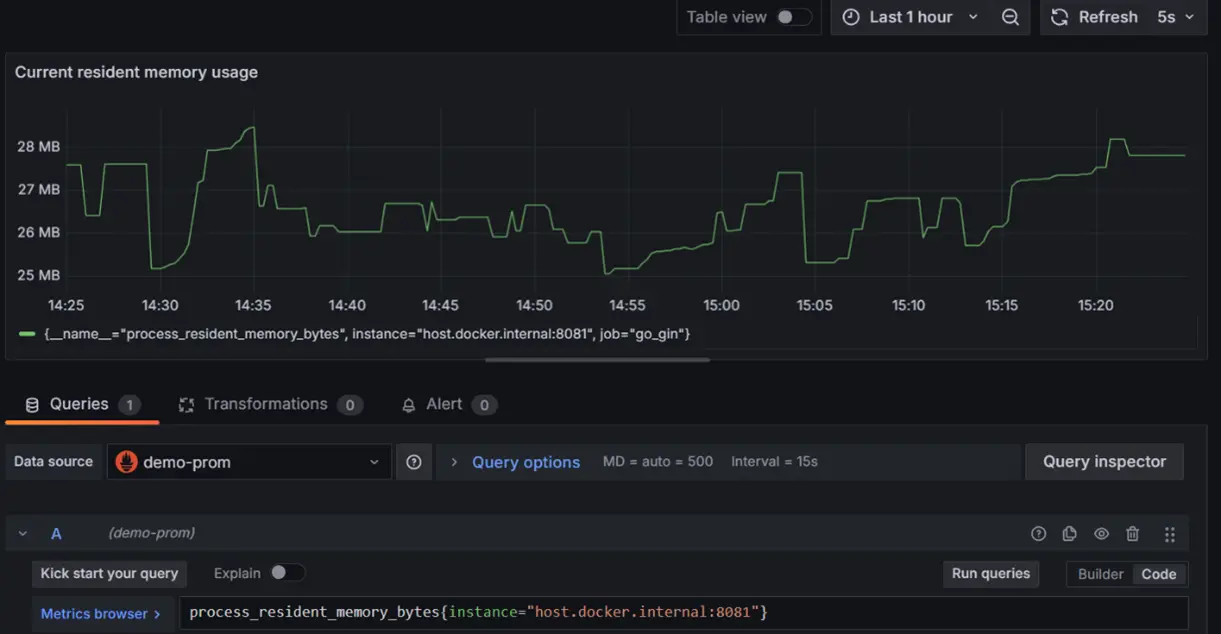
2. Memory Usage – Resident (process_resident_memory_bytes):
- The amount of physical memory (RAM) your application uses.
- Excessive memory usage can lead to crashes or slow performance. Keeping an eye on this metric ensures your application runs smoothly.
- Query:
process_resident_memory_bytes{instance=”host.docker.internal:8081″}
- This query retrieves the current memory usage (in bytes) of a specific application instance, showing how much physical memory (RAM) it occupies. It’s crucial for assessing resource demands and optimizing performance to prevent system slowdowns or crashes.
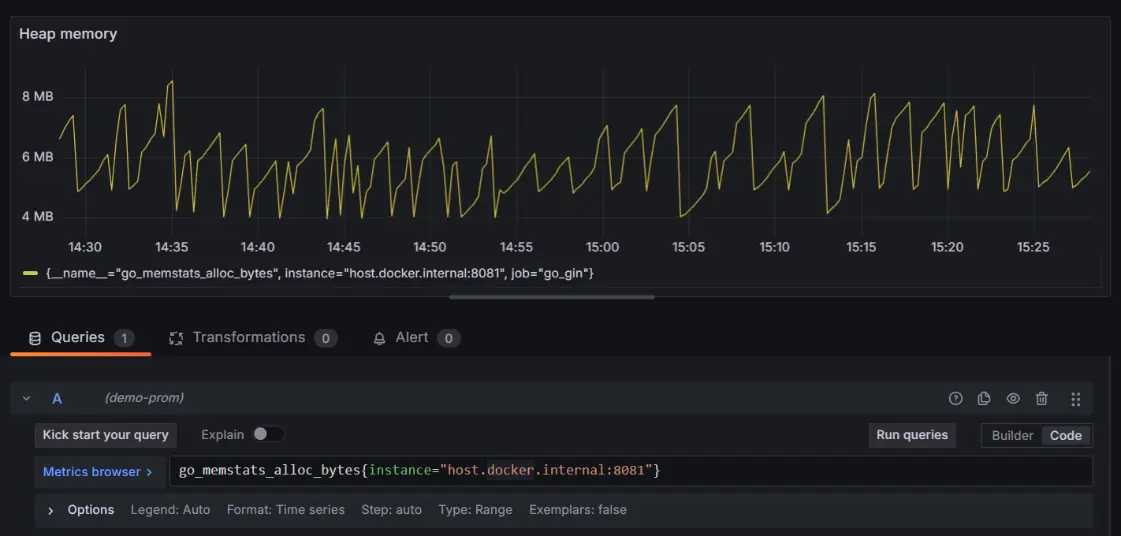
3. Go memory allocation (go_memstats_alloc_bytes):
- Memory allocated by your Go application.
- Query:
go_memstats_alloc_bytes{instance=”host.docker.internal:8081″}
- This query provides the current memory allocated (in bytes) by a Go application instance. It reflects the memory actively used by the application, helping to monitor its memory consumption patterns and optimize for efficiency and stability.
4. Number of Go routines (goroutines):
- The number of goroutines (lightweight threads) running in your application.
- Monitoring goroutines helps you understand concurrency levels and identify potential bottlenecks or issues in your application’s design.
- Query:
avg by(instance)
(go_goroutines{instance=”host.docker.internal:8081″})
- This query calculates the average number of active goroutines (lightweight threads) running in a Go application, grouped by instance. It helps assess concurrency levels and application workload, ensuring the system is handling tasks efficiently without overloading.
Key metrics to monitor (Java):
1. JVM memory usage:
- The amount of memory currently used by Java Virtual Machine (JVM).
- Query:
jvm_memory_used_bytes{instance=”host.docker.internal:8080″, area=”heap”}
- This query retrieves the current heap memory usage (in bytes) of a Java application instance. It focuses on the memory actively used for object allocation in the heap, helping monitor resource utilization and optimize application performance.
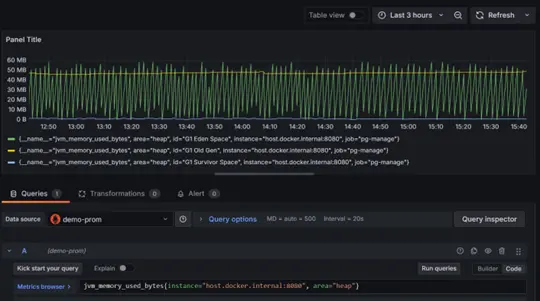
- G1 Eden Space: Represents the memory used for newly created objects, exhibiting sharp periodic spikes due to frequent garbage collection.
- G1 Old Gen: Indicates the memory used for long-lived objects. Its usage is more stable, though it shows some gradual changes.
- G1 Survivor Space: Represents space for objects that survived one or more garbage collection cycles. Its usage remains fairly consistent over time.
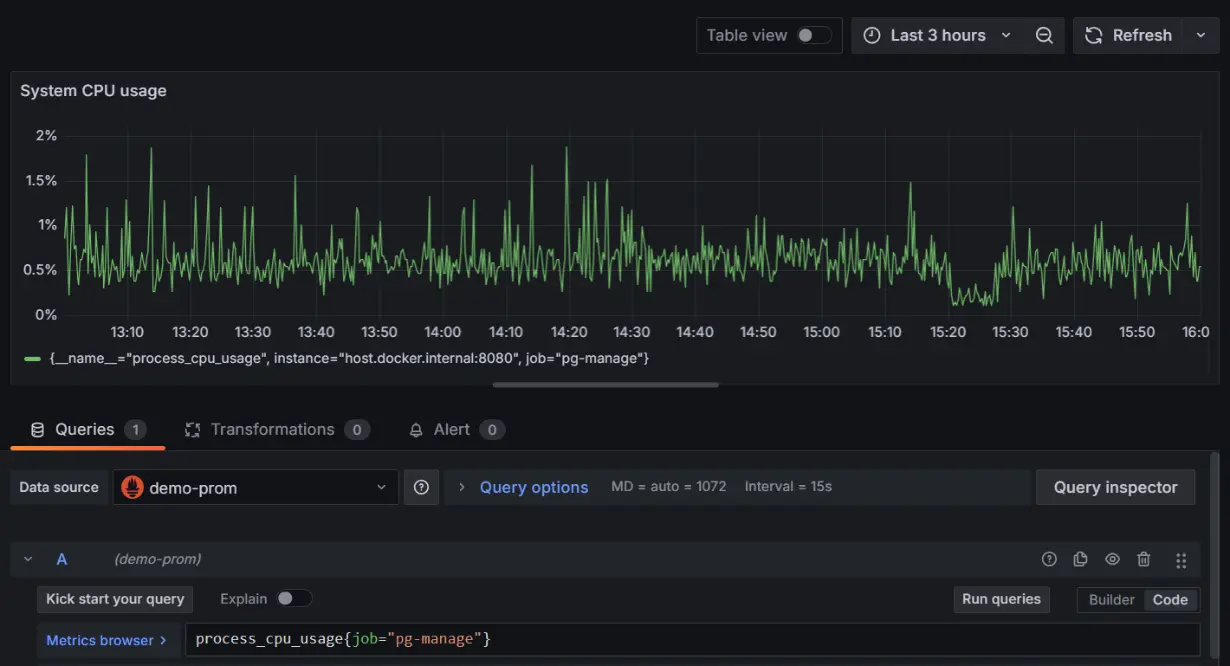
2. System CPU usage:
- The total CPU time consumed by your Java application.
- Query:
process_cpu_usage{instance=”host.docker.internal:8080″}
3. Thread count:
- The current number of live threads in JVM.

Adding Custom Metrics to your application
In Java:
Implementing custom metrics in your Java Spring Boot application is a powerful way to gain deeper insights into specific behaviors and performance indicators that matter most to your business. Here’s how you can set up custom metrics using Prometheus:
Start by creating a new class named Metrics.java. This class will define the custom metrics you want to track.
Code:
import java.util.concurrent.atomic.AtomicInteger;
import org.springframework.stereotype.Component;
import io.micrometer.core.instrument.Counter;
import io.micrometer.core.instrument.Gauge;
import io.micrometer.core.instrument.MeterRegistry;
@Component
public class Metrics {
// A counter to keep track of the total number of requests
private final Counter requestCounter;
// An atomic integer to keep track of the current number of concurrent
private final AtomicInteger concurrentRequests = new AtomicInteger(0);
public Metrics(MeterRegistry meterRegistry) {
// Create and register a Counter with the MeterRegistry
// The counter tracks the total number of requests
this.requestCounter = Counter.builder(“requests_count”)
.description(“total number of re-quests”).register(meterRegistry);
// Create and register a Gauge with the MeterRegistry
// The gauge tracks the current number of concurrent requests
Gauge.builder(“requests_concurrent”, concurrentRequests, AtomicInte-ger::get)
.description(“Current number of concurrent requests”)
.register(meterRegistry);
}
// Method to increment the number of concurrent requests
public void incrementConcurrentRequests() {
concurrentRequests.incrementAndGet();
}
// Method to decrement the number of concurrent requests
public void decrementConcurrentRequests() {
concurrentRequests.decrementAndGet();
}
// Method to increment the request counter
public void incrementRequestCounter() {
requestCounter.increment();
}
}
Explanation:
- Counter (requestCounter): Tracks the total number of requests your application has processed. This helps in understanding usage patterns and overall load.
- Gauge (concurrentRequests): Monitors the number of requests currently being handled. This metric is useful for assessing real-time load and identifying peak usage times.
Utilize the Metrics in your application
To effectively track custom metrics, you can implement a filter class that intercepts every incoming HTTP request. This approach is clean, centralized, and ensures that your metrics are consistently updated without requiring changes to your existing controllers.
Code:
@Slf4j
@Component
@Order(1) // Ensures this filter runs early in the filter chain
@AllArgsConstructor
public class MetricsFilter extends OncePerRequestFilter {
private static final String METRICS_ENDPOINT = “/actuator/prometheus”;
private final Metrics metrics;
@Override
protected void doFilterInternal(@NonNull HttpServletRequest request, @NonNull HttpServletResponse response,
@NonNull FilterChain filterChain)
throws ServletException, IOException {
// Skip metric collection for Prometheus scrape requests
// to avoid self-monitoring overhead.
boolean isMetricsRequest = request.getRequestURI() != null && request.getRequestURI().equals(METRICS_ENDPOINT);
if (isMetricsRequest) {
filterChain.doFilter(request, response);
return;
}
metrics.incrementRequestCounter();
metrics.incrementConcurrentRequests();
try {
filterChain.doFilter(request, response);
} finally {
metrics.decrementConcurrentRequests();
}
}
}
Explanation:
- The doFilterInternal() method intercepts every HTTP request to your application.
- Requests to the Prometheus metrics endpoint (/actuator/Prometheus) are ignored to avoid unnecessary self-monitoring overhead.
- metrics.incrementRequestCounter(): Tracks the total number of processed requests.
- metrics.incrementConcurrentRequests() and metrics.decrementConcurrentRequests(): Monitors the number of requests being processed concurrently.
- The ‘finally’ block ensures that the concurrent request count is decreased even if an exception occurs, maintaining metric accuracy.
Advantages of using this approach
1. Centralized Monitoring Logic
The filter provides a single, centralized location for handling metric updates, making your application easier to maintain and extend.
2. Non-Intrusive
No changes are required in your existing controllers or business logic, ensuring a clean separation of concerns.
3. Fine-Grained Control
You can easily exclude specific endpoints (like /actuator/prometheus) or add custom logic to skip metrics tracking for other endpoints.
4. Accuracy and Reliability
By using the ’finally’ block, you ensure that the concurrent request count is always decreased, even in the event of errors or interruptions.
Extending the filter logic
If your application has specific requirements, you can customize the filter further:
private static final Set EXCLUDED_ENDPOINTS = Set.of(“/actuator/prometheus”); // Add your endpoints here
private boolean isExcludedEndpoint(HttpServletRequest request) {
return EXCLUDED_ENDPOINTS.contains(request.getRequestURI());
}
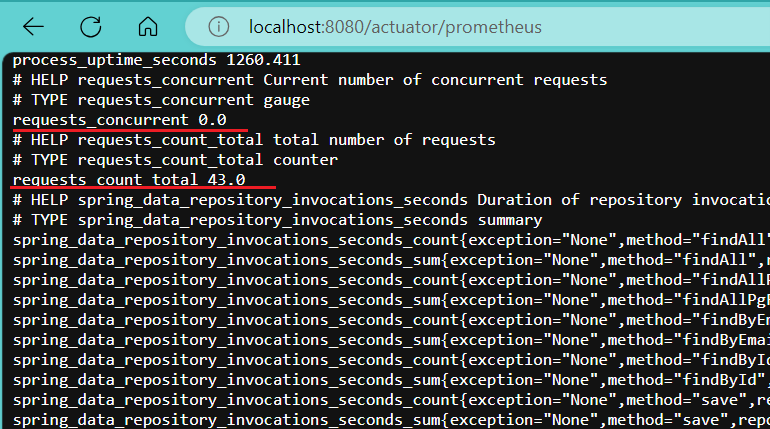
Now, run the application again and you should see the new metrics appearing in the /actuator/Prometheus endpoint and as well as in the Prometheus server.
In go:
Code:
Start by creating a new file named metrics.go in your project directory. This file contains the definitions of your custom metrics.
In the metrics.go file, define the custom metrics you wish to track. In this example, we’ll create a counter for total requests and a gauge for concurrent requests.
import (
“github.com/prometheus/client_golang/prometheus”
“github.com/prometheus/client_golang/prometheus/promauto”
)
var totalRequestCount = promauto.NewCounter(prometheus.CounterOpts{
Name: “requests_count_total”,
Help: “The total number of requests”,
})
var concurrentRequests = promauto.NewGauge(prometheus.GaugeOpts{
Name: “requests_concurrent”,
Help: “Concurrent number of requests”,
})
Explanation:
1. totalRequestCount (Counter):
- Purpose: Counts the total number of requests processed by the application.
- Use Case: Helps in understanding the application’s load over time.
2. concurrentRequests (Gauge):
Purpose: Tracks the number of requests currently being processed.
Use Case: Provides real-time insight into the application’s current load and performance.
Quick Tip: Handling Path Parameters in Routes
When adding metrics for routes, paths with parameters (e.g., /user/1) are treated as separate paths. To normalize these paths (e.g., /user/{id}), you can use the following code snippet in your Gin application:
normalizedPath := c.FullPath()
if normalizedPath == “” {
normalizedPath = c.Request.URL.Path
}
This ensures consistent metric labeling for routes with path parameters, avoiding unnecessary proliferation of unique paths in your metrics.
Implement the Metrics in your application
Integrate the custom metrics into your application by incrementing and decrementing them at appropriate places in your code.
Code:
func handler(c *gin.Context) {
// Increment the total request counter
totalRequestCount.Inc()
// Increment the concurrent requests gauge
concurrentRequests.Inc()
// … your business logic here …
// Decrement the concurrent requests gauge
concurrentRequests.Dec()
}
Explanation:
totalRequestCount.Inc(): Increments the total requests counter each time the handler is invoked.
concurrentRequests.Inc(): Increments the concurrent requests gauge to reflect a new request is being processed.
concurrentRequests.Dec(): Decrements the concurrent requests gauge once the request has been processed.
With the custom metrics implemented, run your application to see them in action.
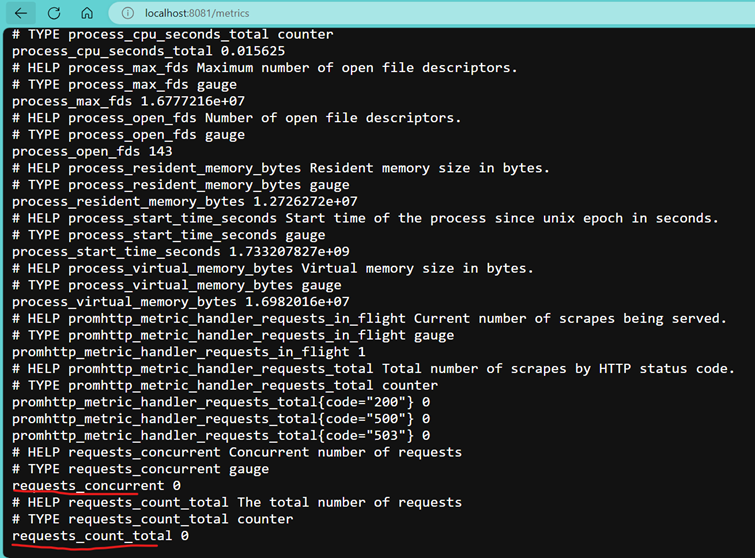
Navigate to http://localhost:8081/metrics, and you should see your custom metrics: requests_count_total and requests_concurrent among the default metrics exposed.
Insights from Prometheus Metrics
PromQL Functions for Counter Metrics
Raw counter values can be misleading because they reflect cumulative counts that are only meaningful in the context of their start time. To derive useful insights, such as the current request rate, you typically need to compute the rate of increase.
Prometheus Query Language (PromQL) provides several functions to analyze counter metrics, particularly to compute the rate of increase.
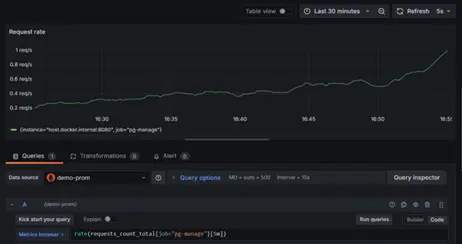
rate():
- Computes the per-second average rate of increase over a specified time range.
- Useful for visualizing long-term trends and averages.
- Example Query:
rate(requests_count_total[5m])
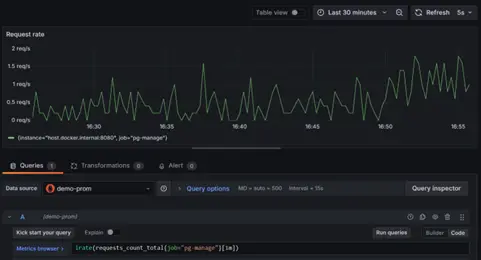
irate():
- Computes the instantaneous rate of increase by only considering the last two samples within the range.
- Useful for detecting spikes or sudden changes in metrics.
- Example Query:
irate(requests_count_total[1m])
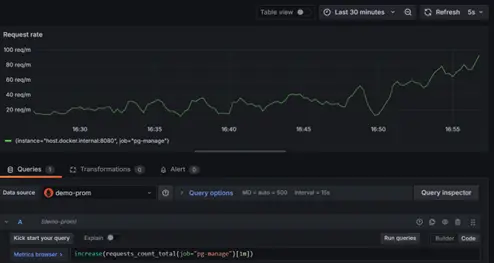
increase():
- Calculates the total increase over a given time range.
- Provides an absolute value increase rather than a per-second rate.
- Example Query:
increase(http_requests_total[5m])
Counters can reset to zero in certain situations, such as:
- A system/process restart.
- A metric value exceeding the storage limit for integers.
Points to consider for counter resets
Extrapolation limitations:
- Prometheus can’t directly observe the exact values at window boundaries or just before a reset.
- For fast-moving counters, the extrapolation aligns closely with the real behavior.
- For slow-moving counters, the extrapolated values might significantly differ from the actual values.
Impact on Non-Integer Value:
- Functions like increase may return non-integer results due to interpolation, even if the counter increments by whole numbers.
Tips for Reading Graphs with Counter Resets
- For rate and increase, check if trends remain consistent post-reset.
- Look for sudden spikes or unusual slopes that may indicate issues.
- Use shorter query ranges with irate for high-resolution analysis and longer ranges with rate or increase for smoother trends.
Some creative ways to Gain insights from Metrics
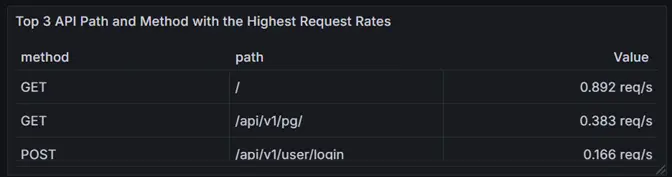
Use case: Identify Top 3 Most accessed Endpoints
There are many creative ways you can gain insights from metrics. For example, the custom metric request_duration_path_seconds provides valuable insights into the time taken for requests to specific paths in your application. This metric is designed to help you monitor and analyze request patterns effectively.
Using a PromQL query, you can determine the top three most accessed endpoints by path and method over the last five minutes. Here’s the query:
topk(3, sum by(method, path)
(rate(request_duration_path_seconds_count{instance=”host.docker.internal:8080″}[5m])))
What it does:
- Identifies the most frequently accessed API paths, broken down by HTTP method.
- Pinpoints high-traffic endpoints to focus optimization efforts.
Use case: Calculating Average Response Duration Over Time
The request_duration_ms metric (Summary metric) provides insights into the response time distribution for your application. It measures the time taken for requests and supports calculating useful performance metrics like average response duration, quantiles (e.g., 50th, 90th percentile), and maximum response time.
Using this PromQL, you can calculate the average response duration over time.
rate(request_duration_ms_sum[5m]) / rate(request_duration_ms_count[5m])
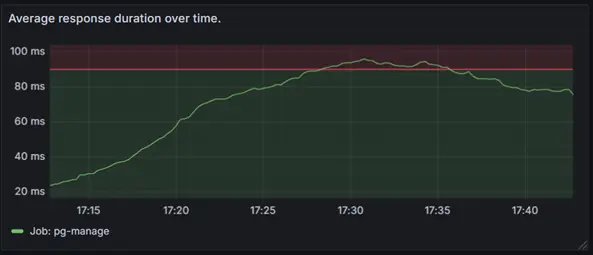
his graph provides a clear and concise visualization of your application’s performance over time.
For demonstration purposes, a threshold of 90ms has been added to highlight whether the application is performing within acceptable limits. This allows you to quickly identify instances where the threshold is exceeded, signaling potential performance issues that require attention.
Additionally, this metric enables you to plot quantiles (e.g., 50th, 90th, and 95th percentiles) to gain a deeper understanding of response time distributions.
Example:

Quantiles provide a breakdown of response time. For example:
- 50th percentile (quantile = “0.5”): The median response time i.e. half of the requests are faster than this value.
- 90th and 95th percentile (quantile = “0.9”, “0.95”): Help identify outliners or slow requests that may affect user experience.
- Maximum response time (request_duration_ms_max): Monitors the maximum response time to ensure no individual request takes an unusually long time, potentially impacting user satisfaction.
You can also use this metric to identify the slowest endpoints in your application. By applying a query like the one used earlier, you can pinpoint endpoints with the highest average response times:
topk(3, rate(request_duration_path_seconds_sum{job=”pg-manage”}[5m]))/rate(request_duration_path_seconds_count{job=”pg-manage”}[5m])

For the complete source code and setup, visit the GitHub repository. This example highlights how you can creatively leverage metrics like request_duration_path_seconds to drive actionable insights.
Use Case: Leveraging Histograms for Percentile Analysis
Histograms are incredibly powerful when it comes to understanding the distribution of request durations. Using the request_duration_ms_bucket metric, you can extract percentiles to gain deeper insights into how your application performs under different scenarios.
Query:
histogram_quantile(0.95, sum by (le) (rate(request_duration_ms_bucket{path=”/conc”}[2m])))
- This query calculates the 95th percentile request duration for the /conc endpoint.
- What it means: 95% of requests are faster than the result, and only 5% are slower.
- We can merge the graph for the above query for different percentiles i.e. 0.5 or 0.9.
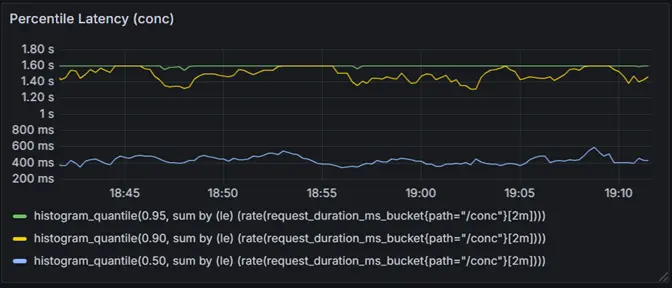
This graph visualizes the percentile latency for the /conc endpoint, showing the 50th, 90th, and 95th percentiles over time.
Key takeaways
In this blog, we explored the powerful capabilities of Prometheus and Grafana for application monitoring and performance analysis. Here’s what we covered:
- Introduction to Prometheus: Why monitoring is essential and how Prometheus fits into modern infrastructure.
- Understanding Metrics: The four core Prometheus metric types—Counters, Gauges, Histograms, and Summaries—with practical examples and key characteristics.
- Setting Up the Monitoring Environment: Step-by-step instructions to configure Prometheus and Grafana and integrate them with Java and Go applications.
- Default Metrics in Prometheus: How to visualize out-of-the-box metrics in Grafana to gain actionable insights.
- Adding Custom Metrics: Techniques to implement custom metrics in Java and Go applications, including best practices and advantages.
- PromQL Insights: Practical PromQL queries for calculating averages, monitoring percentile latencies, and identifying top-performing or slow endpoints.
- Creative Use Cases: How to leverage metrics for deeper insights, such as identifying bottlenecks, optimizing high-traffic endpoints, and tracking application trends.
By the end of this guide, you have the tools to not only monitor your applications effectively but also transform raw metrics into meaningful, actionable insights. Whether you’re a business leader or a developer, these strategies help ensure reliable performance, drive informed decisions, and enhance user satisfaction.
Know More: Cloud Services