In any physical design procedure, Placement and Routing are the two chief steps. To get better QoR in routing, engineers tend to give a first glance to placement density. In this article, we will discuss the method to figure out the range of placement density through various practical data. Using that range, any design can be routable with better QoR. For the sake of discussion, our concentration will be solely on 16nm technology.
As technology nodes shrink, it can be observed that starting utilization is becoming lower and lower in order to make the design routable. Placement density ranges can be very helpful to get better QoR while routing the design. While starting at any of the chips, placement density analysis can be very useful so that better results can be achieved even with lesser number of iterations.
In this paper, we will concentrate on placement utilization in order to make design routable.
The observation can be divided into three categories.
- High Memory(Macro) Count
- Moderate Memory Count
- Without memory
As a comparison point, the following Placement Data have been taken into consideration.
1. High Memory Count
| Block | Instance Count | Standard Cell Area | Macro Area | Number of Macro | Pin Density | Place Density | Routability |
| Block 1 | 1103349 | 652100 | 1128101 | 114 | 09.10% | 44.18% | Yes |
| Block 2 | 1037855 | 821735 | 2107798 | 111 | 06.30% | 46.70% | Yes |
| Block 3 | 272371 | 166379 | 5125594 | 99 | 06.03% | 35.30% | Yes |
| Block 4 | 2241627 | 1367530 | 1341723 | 120 | 14.80% | 52.80% | No |
| Block 5 | 1103349 | 652100 | 1128101 | 114 | 12.20% | 51.93% | No |
| Block 6 | 1037855 | 821735 | 2107798 | 111 | 11.13% | 53.70% | No |
2. Moderate Memory Count
| Block | Instance Count | Standard Cell Area | Macro Area | Number of Macro | Pin Density | Place Density | Routability |
| Block V | 427856 | 998400 | 303156 | 49 | 9.50% | 45.503% | Yes |
| Block W | 1094376 | 719053 | 474668 | 35 | 12.50% | 50.12% | Yes |
| Block X | 772434 | 548723 | 806259 | 32 | 11.45% | 56.16% | Yes |
| Block Y | 1458142 | 859468 | 321277 | 41 | 16.90% | 61.30% | No |
| Block Z | 1294260 | 622653 | 1862089 | 49 | 15.03% | 60.56% | No |
3. Without memory
| Block | Instance Count | Standard Cell Area | Number of Macro | Pin Density | Place Density | Routability |
| Block A | 820156 | 490512 | 0 | 28.60% | 59.90% | Yes |
| Block B | 2872407 | 1571854 | 0 | 26.46% | 56.40% | Yes |
| Block C | 2956966 | 1600010 | 0 | 27.59% | 68.10% | No |
| Block D | 765153 | 44825 | 0 | 36.01% | 70.80% | No |
| Block E | 783165 | 466226 | 0 | 26.60% | 69.95% | No |
In case we are dealing with a bit higher memory count so that the macro area is way ahead of standard cell area, the placement utilization can be achieved somewhere near 45% to 50%. The Macro will have more numbers of pins due to which it needs more quantity of routing resources which will end up taking lower placement density. However, if memory count is on the lower side or moderate so that macro area is equal or less than standard cell area, placement utilization can be achieved somewhere near 55% to 60%. In case we are considering memory less blocks, Placement utilization can be achieved nearer to 65%. As soon as the block has a macro area equal or less than standard cell area, pin density per unit area will be less compare to macro dominant blocks. Due to lower pin density per unit area, the block can take higher placement density area. As specified in the last column, the design will be only routable if placement density is in above mentioned range for a specific category.
RELATED INFOGRAPHICS
5 Proven Tips for Right Time-to-Market at 16nm Lower Technology Node
Same as Place density, Pin density is also a good comparison point. For high memory count blocks, it should not be more than 15% and for moderate memory count blocks or memory less blocks, it can go up to 30%. Once place density or pin density crosses the range which has been discussed here, it will be pretty difficult to close the block. Here, pin density is considered as a total quantity of pins divided by total instance area of the block.
In case someone wonders what are the reasons that makes it so difficult to achieve higher density into 16nm chips. Here are some of the reasons.
- As double patterning is introduced at lower technology nodes, a whole new set of DRC rules need to be taken into consideration which directly affects the routing
- Many other DRC rules are also introduced at lower nodes which have to be taken into consideration while routing the design
- As cells geometry becoming smaller and smaller, Pin density per area is increased. Due to which more route resources will be used per area. This is the exact reason why we have taken pin density into consideration while doing comparison
- Sometimes, redundant pins are also used due to very specific requirements at lower nodes. Once we have more than one physical shapes for same pin which is known as redundant pins, obviously more routing resources will be used which will result in lower placement utilization
On top of all these, all above data are taken from one of the networking chips. As power requirement is very critical for networking chips, Power planning is done across all the layers. Which means routing resources will be very critical for these blocks.
Best techniques for higher density blocks in 16nm Chips
Once starting utilization is in above mentioned range, one still needs to have a recipe in order to make design routable.
We will discuss some ingredients from the recipe.
1) Cell padding for Flops, aoi, oai cells
If we are facing dense congestion spot in the core area, it is very much possible that it is because of high pin density in a particular area.
So, we can apply cell padding for those sequential or combinational cells which are having high number of pins.
For example,
specifyCellPad *_oa* 2
specifyCellPad *_ao* 2
specifyCellPad *dff* 2
Without cell Padding
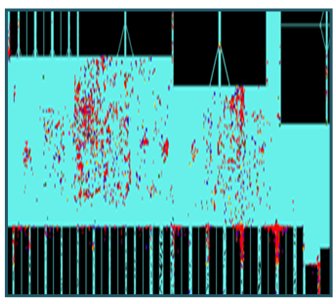
QoR
Density: 48.001%
Congestion: 0.27% H and 0.41% H
Timing: 0.00 WNS R2R
With Cell Padding
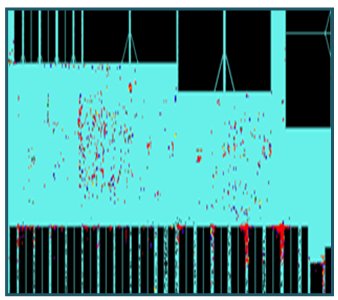
QoR
Density: 48.221%
Congestion: 0.16% H and 0.37% H
Timing: 0.00 WNS R2R
2) Uniform Density
Uniform Density can be used at the placement stage. Using this setting, a tool will try to spread logic equally throughout the design. So this will spread the logic a bit and help in congestion.
This setting can be used once we analyze our placement database.
If we are observing empty space or spot as shown in figure-1, we can try to spread that uniformly throughout the design as shown in figure-2.
Placement Density might increase as logic will be speared a bit however overall QoR will be improved.
With Default setting
setPlaceMode -uniformDensity false
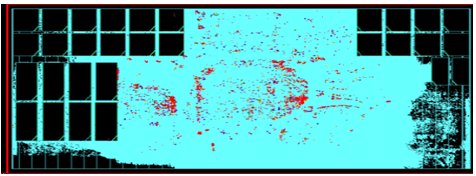
QoR
Density: 48.861%
Congestion: 0.65% H and 1.27% H
Timing: -0.233 WNS R2R
With uniform Density
setPlaceMode -uniformDensity true

QoR
Density: 50.449%
Congestion: 0.39% H and 0.79% H
Timing: -0.181 WNS R2R
3) Blockages between narrow macro channels
Macro channel blockages according to logic spread-ed.
There will be macro channel as per basic requirement of macro placement. Partial blockages can be used to avoid extra logic to be seated into those channels and congestion can be reduced.
finishFloorplan -density 10 -fillPlaceBlockage partial 50 -namePrefix channel
With Default setting
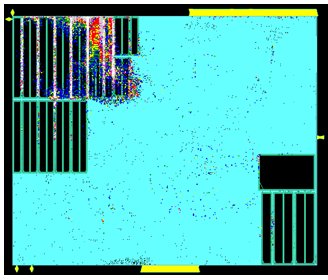
QoR
Density: 53.657%
Congestion: 1.54 % H and 2.34 % H
Timing: -0.401 WNS R2R
With soft blockages between macro channels
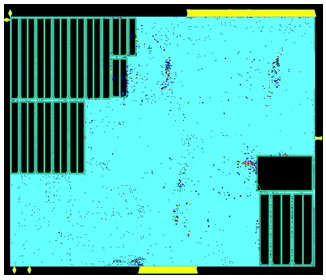
QoR
Density: 52.796%
Congestion: 0.24% H and 1.18% H
Timing: 0.00 WNS R2R
4) Skiptrack
option while doing Trial Route will also help in case congestion is a bit on the higher side.
Skip Track can be used from metal4 to metal10 with the ratio of 1:5.
Skip Track option can be used while Trial Routing. Trail Route will skip 1 track at every 5 track to make detail route easier.
setTrialRouteMode -skipTracks “M4 1:5 M5 1:5 M6 1:5 M7 1:5 M8 1:5 M9 1:5 M10 1:5”
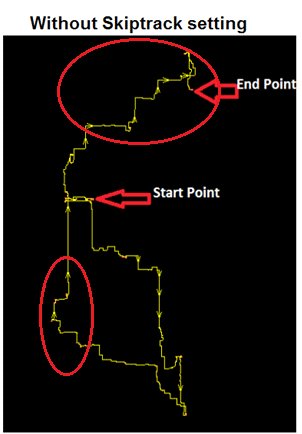
QoR
Density: 50.001%
Congestion: 0.50% H and 0.59% H
Timing: -0.094 WNS R2R
No. of Shorts: 28
Net Length: 1718 um
Logic Depth: 56
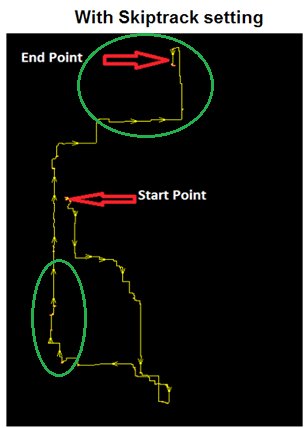
QoR
Density: 48.001%
Congestion: 0.45% H and 0.50% H
Timing: -0.025 WNS R2R
No. of Shorts: 4
Net Length: 1374 um
Logic Depth: 49
Conclusion
Placement Density range is concluded in this paper to have a better QoR.
- In case of higher memory count, range can be 45% to 50%
- In case of moderate or no memory count, range can be 55 to 60%
Once placement density is defined, still cell padding, macro channel blockages, skip Tracking, uniform density are the option which can be used to have a better QoR results after routing.


