The Big data analytics revolution is making its impact felt everywhere, and the healthcare industry has been riding high on the new revolution (eInfochips white paper on healthcare analytics). Effective sampling, interpretation and visualization of clinical data is often understood as the key to quality patient care. In the discipline of mental healthcare, the ramifications of big data analytics becomes even bigger as without effective visualization capabilities, you simply cannot make sense of large volumes of patient data.
Traditionally, telephonic interviews were used to assess mental health but because of the private nature of such responses, the results haven’t been that trustworthy. Also, analysts cannot collect as much data as required in assessing patterns, especially for rare mental illness. Seeing the larger picture, and visualizing noticeable patterns, is critical to developing a cohesive strategy which takes care of patient well-being while helping hospitals, mental health clinics and practitioners optimize their resources in the best possible way.
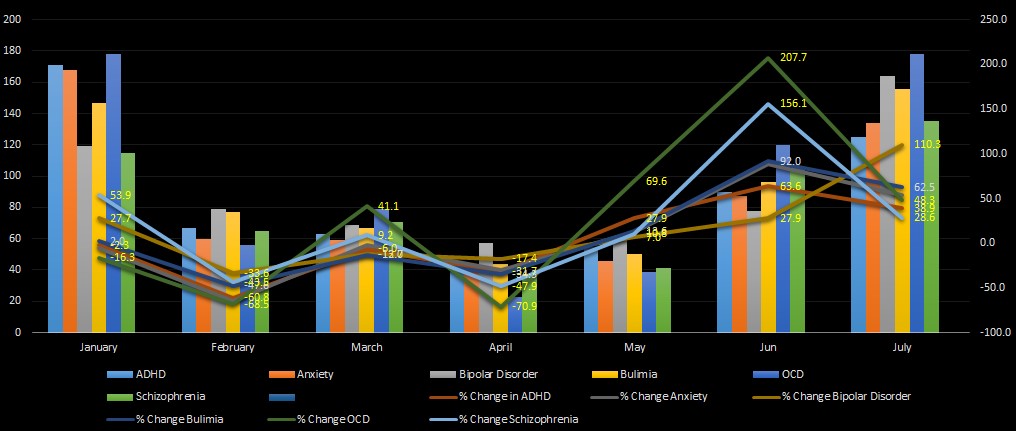
A survey was done in California between 2008 to 2013 focusing on major mental diseases including ADHD (attention deficit-hyperactivity disorder), anxiety, bipolar depression, anorexia or bulimia (eating disorders), OCD (obsessive-compulsive disorder) and schizophrenia. The results are depicted in the table below.

By applying analytics on these collected data, seasonal patterns were found. According to the seasonal component in the pattern, it was found that winters were particularly bad in terms of exacerbating the conditions compared to other seasons. However, looking at the charts alone, a statement like that becomes a guesstimate. What if the number of rows and columns are in their tens of thousands? Would you be able to predict a pattern based on visual observation alone? No way.
This is where data visualization tools like Tableau make a huge difference, giving you results and patterns that you couldn’t have spotted at first glance.
In our study, by observing seasonal weather patterns, the connections between seasons and a number of other major disorders was found noticeable.

It was found that OCD searches were down 70 percent in summer versus winter and schizophrenia searches decreased 58 percent during summers. Bipolar searches were down nearly 50 percent during U.S. summers and ADHD searches decreased by 70 percent in the U.S. To use these data effectively, tool like MongoDB can process and store billions of bytes of such real time data, with hundreds of thousands of transactions per second.
Big data can further help in predictive analytics by representing a history of psychiatric issues that can help unlock and predict before a new traumatic disorder happens. Here are some examples that illustrate it better.
Data analytics via cloud platform integrated with smartphone interface. The device hears (acquires) the speech of the patient being interviewed, and sends it to a cloud server managed by the healthcare facility for transcription and de-identification (for patient confidentiality). The output is then analyzed by a separate data analytics software like Tableau or MongoDB on cloud, which returns results to the device – comparing the patient’s speech against other previously diagnosed patients. The density of “loops” in a patient’s speech is taken into consideration, as compared to the normal people.
Thus, data sitting idle is of no use and big data analytics can prove very vital in mental healthcare because of sheer visualization possibilities of patient information. Proper data visualization forms the backbone of a well-formulated analytics strategy. Tableau, with over 28000 customer accounts, is at the forefront of addressing one of the biggest challenges in data visualization – making databases and spreadsheets understandable to ordinary people. At eInfochips, a premier Tableau Alliance partner, we are capable of delivering healthcare analytics s tailor-made to specific organization’s needs.


