Enterprises today depend on high performance, in-memory applications more than ever before. Whether you use BI/Analytics, SaaS, sales and marketing automation, virtualization, real time collaboration, Web 2.0 or software product engineering tools, it is expected that important business questions should be answered in the fraction of a second. To ensure that, analyzing memory becomes a very crucial task.
With the increasing blurring of boundaries between transactional (OLTP) and analytical (OLAP) data management systems, the trend of separate databases is dying out making memory analysis complicated and confusing. Also, at the time of code development, it is difficult to assess an application’s memory usage in the actual production environment. The code alone does not help much in figuring out which object would consume more memory. In order to have advanced diagnostics capability, developers should be mindful of garbage collection at the time of writing code itself. Let’s say, we have an array of objects “userMap”, which stores the data of logged in users and session ids. For this array, if we forget to remove unused array object references in code, the memory consumed by these objects may never be reclaimed resulting in out of memory conditions/server crash.
Tools like Garbage Collector (GC) provide automated memory management. An object is eligible for garbage collection when no live thread can reach it which means there are no references to that object. Having said that, GC may not be able to reclaim all unused object memory. In such situations, it is easy to run out of memory resulting in application crashes/hang-ups.
Eclipse’s open source-based Memory Analyzer tool (MAT) is being extensively used in engineering products and service designs to help track those pesky bugs. Here, I will share the biggest advantages of working with MAT based on my experience in our ongoing project with a leading home automation player in the US. We have been able to achieve the following results:
- Closing down on memory leaks down to smallest sized bits
- Improved application performance
- Improved timing
What is Memory Analyzer Tool (MAT)?
The Memory Analyzer Tool (MAT) is a plugin in Eclipse for Java heap memory troubleshooting to find memory leaks and reducing memory consumption.
Let’s take a simple example in analyzing memory. First install MAT plugin in Eclipse [eclipse -> Help -> Install New Software -> Give this URL: http://download.eclipse.org/mat/1.5/update-site/].
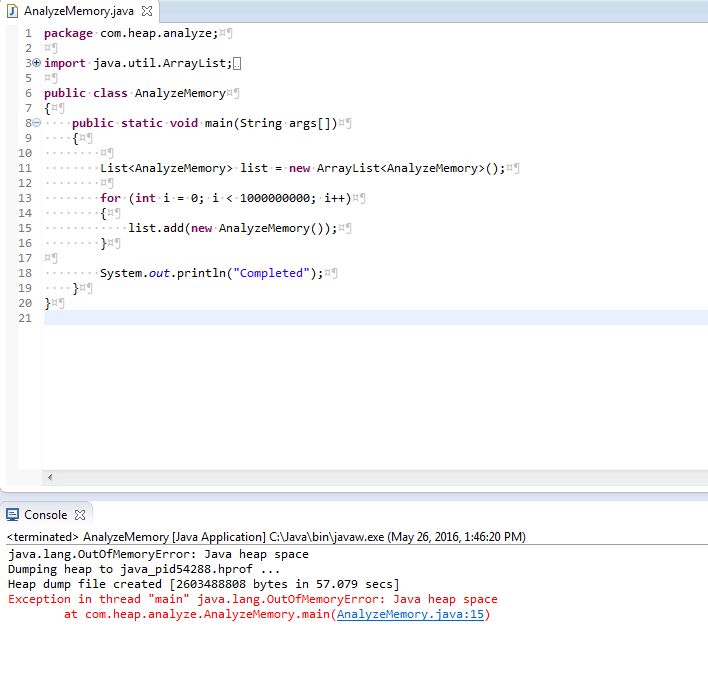
The sample code acquires lots of heap sizes resulting in “OutOfMemoryError” error.
In run configuration settings, in VM arguments, add “-XX:+HeapDumpOnOutOfMemoryError” and run the application. You will see a message “Heap dump file created”.

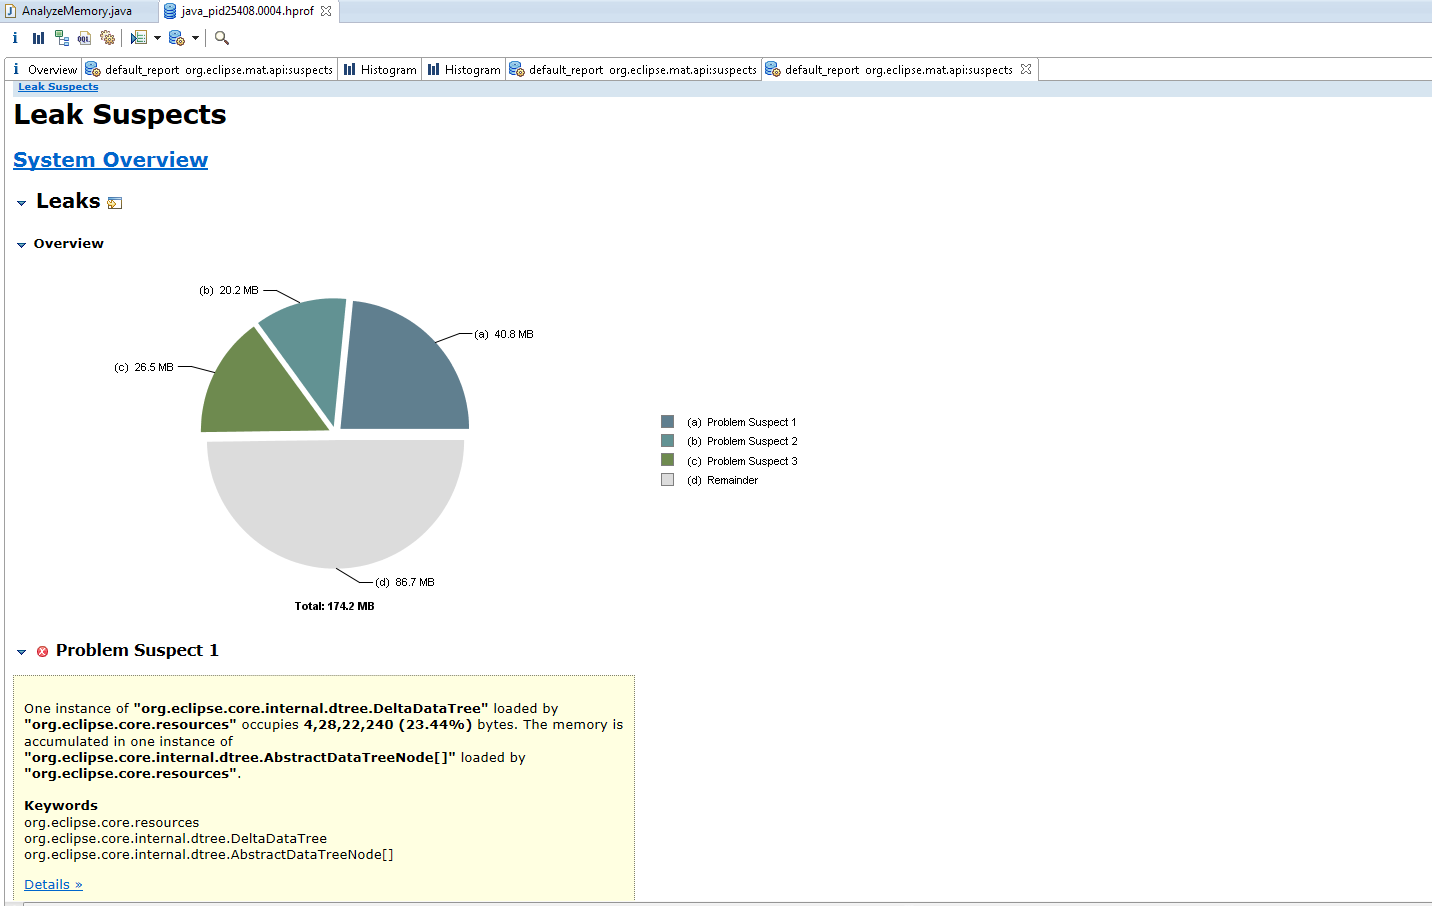
By clicking on dumb file, MAT wizard opens. Select “Leak Suspects Report” which opens system overview report and displays possible problem suspects in pie chart.
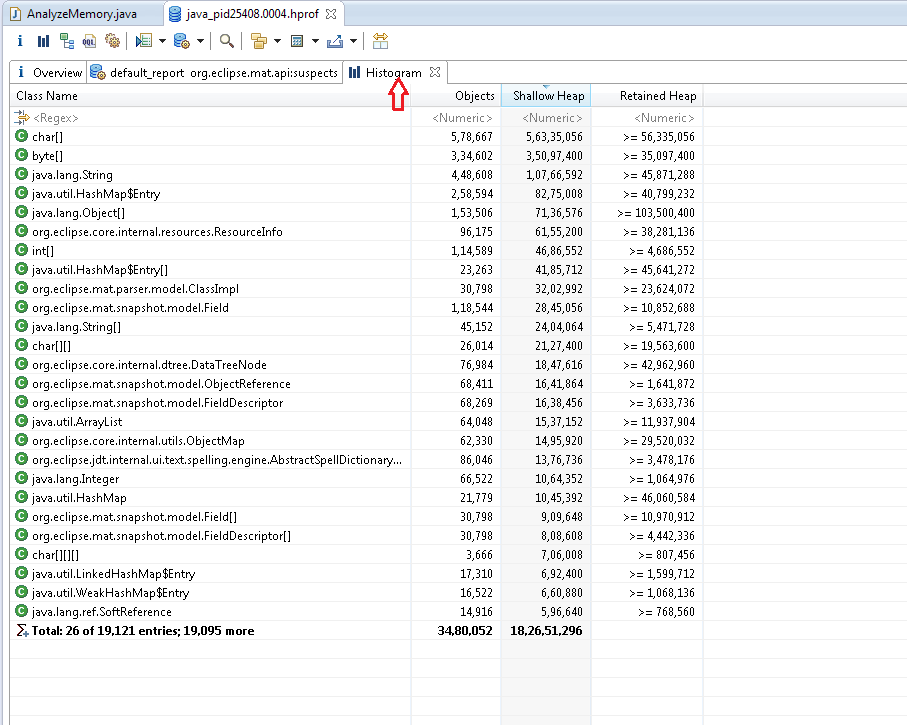
MAT also gives histogram for classes and objects. It gives all the information connected to loaded classes, ‘super classes’ name, loader of class, class’ static fields, Objects of class, size of collection used etc.
– Histogram example.

– Leak suspect report example :

MAT also gives the following features below:
- Dominator Tree: List the biggest objects and how they are kept alive,
- Top Consumers: Print the most expensive objects grouped by class and by package,
- Duplicate Classes: Detect classes loaded by multiple class loaders.
This basic understanding of memory analyzer tool makes it clear that Eclipse MAT is very helpful to developers to track leaks and other bugs related to memory. Developers can find root cause very quickly which is very difficult to do by studying code. In summary, this helps clients get close to high performance applications. We would be happy to hear your own ideas on how memory applications can be speeded. If you want more information on this topic or drop in new suggestions, you’re welcome to email us at marketing@einfochips.com


