The usual definition of a smart meter is that it is an electronic device that records consumption of electric energy in periodic intervals and communicates the information on a routine basis back to the utility. But, this definition needs to evolve due to the rapidly changing role of the smart meters.
The smart meter data when processed under an analytics engine delivers multi-faceted insights. The data is raw, high volume and emerges at the utility end with peak velocity. Meter data is collected at varied frequencies to match the analytics use cases. It is ascertained that the electric meters send an average of 10,000 pulses per meter per day, at a peak power of 2 1/2 watts and a maximum of 190,000 per day.
Top smart meter data use cases include customer experience improvement, asset maintenance and monitoring, utility operations and reliability assurance. A smart meter can offer customers a way-in, into their energy usage, usage pattern, anomalies, billing details and eventually a way to save money by tweaking each parameter.
Alternatively, the meter event data can indicate meter status, power factor, voltage sag/ swell, tampering, battery status, configurations, etc. From this data, pattern identification can be made for unplanned outages, restoration time and the like. When clubbed with current device status and weather data – it can be used to predict failures and even prevent them eventually. If prevention is not possible, faster detection and restoration helps utilities to adhere to SLAs.
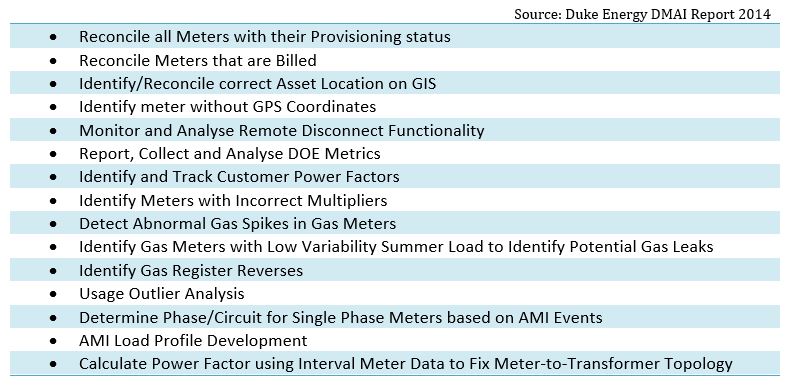
Top Smart Meter Data Analytics Use Cases:

Smart meters rely on data to benefit all departments within the utility – CIS, Operations/ NMS, billing and support – just like a Genie, it does it all.
A wider set of utility analytics use cases has been discussed at this URL: Shaping up Analytics for the Smarter Grid.


